"Redefining Excitement in XR"
The Excite-O-Meter is a user-friendly Unity plugin for XR creators to integrate physiological user information in the development and evaluation of XR content. Specifically, it allows to record, analyze, and visualize scientifically validated metrics of heart activity during XR experiences. It's extendable with devices based on the LabStreamingLayer.
About
The Excite-O-Meter includes features for both online and offline analysis of cardiovascular data, allowing a synchronized analysis of the physiological information, the events happening in the virtual environment and the perceived experience of users.
The tool includes a simplified visualization of a meter that varies with the levels of excitement measured through HRV parameters, allows the analysis of multiple session at the time to ease comparative analysis and includes a data logging system for post-hoc analysis.
Technical
The delivered MVP is aimed at the Windows platform, as that is the most flexible platform for thirdparty hardware. The plugin itself exists of different components (see website) but the main logic is build in C# for the Unity environment. Recorded data is saved to disk as JSON for the internal visualization module, but also in raw CSV format to be be usable for analyses packages.
The delivered MVP is aimed at the Windows platform, as that is the most flexible platform for thirdparty hardware. The plugin itself exists of different components (see website) but the main logic is build in C# for the Unity environment. Recorded data is saved to disk as JSON for the internal visualization module, but also in raw CSV format to be be usable for analyses packages.
My role
That came down to the question 'How can we present the stored data as logic, intuitive and comprehensive as possible for one or multiple sessions of multiple forms of data?'
That came down to the question 'How can we present the stored data as logic, intuitive and comprehensive as possible for one or multiple sessions of multiple forms of data?'
Researching existing Unity dataviz assets did not lead to a total solution. In order to not reinvent the wheel but stay flexible, building on top of the existing Unity UI-Extensions SDK was the best approach.
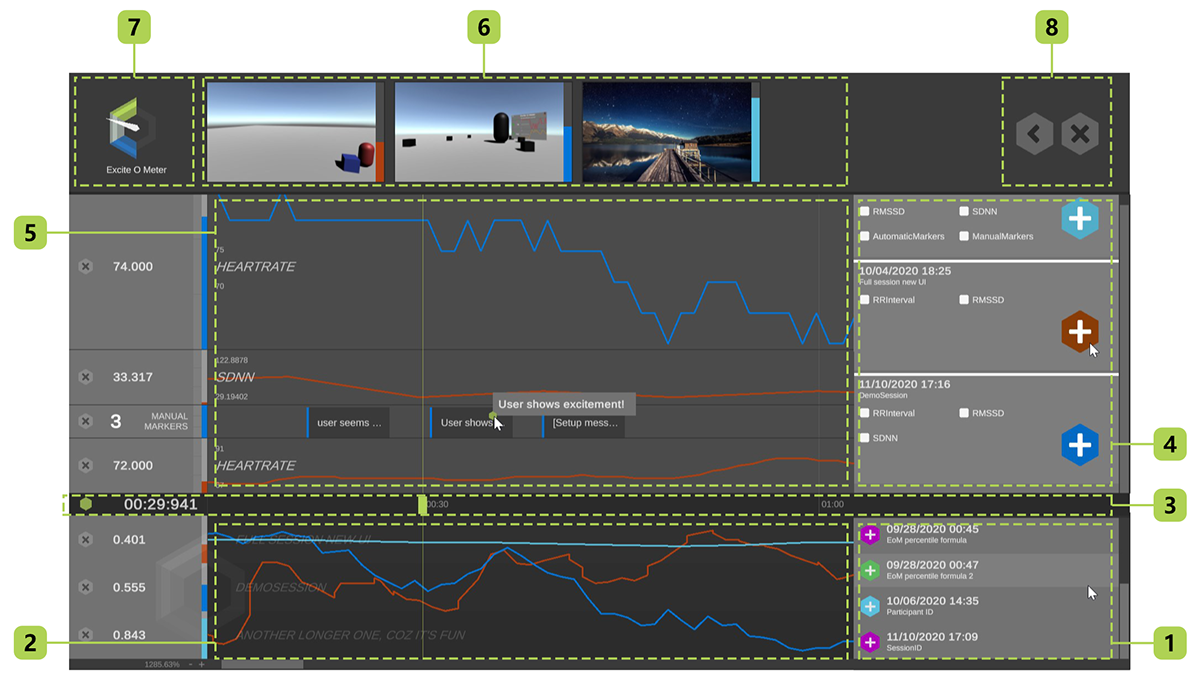
Inspired by approaches of related software, the offline module layout, is based on a two-column, one-row layout. On the right side the data plotted on the timeline and on the left side the value of that data at that timestamp [3] . The MVP supports displaying datastreams (graphs) and events in time (markers) but can be extended with other types.
It's possible to add a datarow by selecting any type of data [4] from a loaded session [1] that is not plotted [5] yet. All data related to one session has the same color coding to easy comprehend how the data relates to each other.
The rows can be reordered, added, removed, or extended to provide maximum flexibility for the analyst using the tool.
On the bottom [2] is the main Excite-O-Meter row which contains the excitement result from one or maximum 3 loaded sessions.
To be able to link the shown data to the actual displayed environment in XR, screenshots were grabbed and saved to disk with a fixed interval (possibly extendable with a video feature futurewise). These screenshots displayed in a separate component [6] on screen.
Logo design
As the concept of the project is to present the user with an excitement value as a visual meter, hence the Excite-O-Meter name, this meter had to part of the interface.
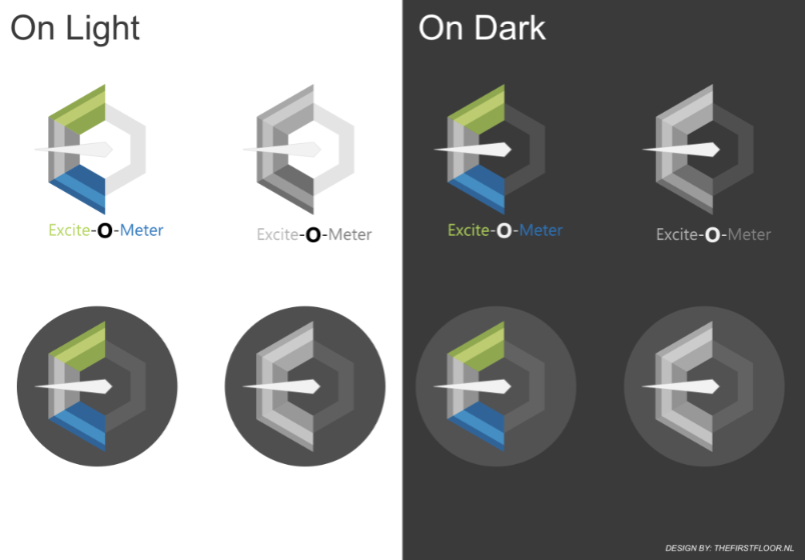
After a few iterations, we ended up using this meter also for the main logo as it represents everything the project contains in one image. [7]
The interface's interactables are an abstraction of the hexagonal logo shape for visual consistency.
Team
This project was worked on with a collection of neuroscientists, psychologists, technologist, informatician and developers.
The full team can be found here.
Source GNU GPLv3
More info
Tags: #Unity3D, #XR, #VR, #Bodily, #HRV, #Dataviz, #Wearable, #Physiological, #interactiondesign

Example workflow showing recording and presenting data of one session in the Unity editor.
The Excite-O-Meter project was developed under an open call of the XR4all community, a co-funded initiative of the European Union's Horizon 2020 research and innovation programme. This project has received funding from the European Union’s Horizon 2020 research and innovation programme through the XR4ALL project with grant agreement No 82554.

